Make America Number One In Every Category
- Don Hilborn
- Jan 14
- 10 min read

Updated: Feb 27
Introduction
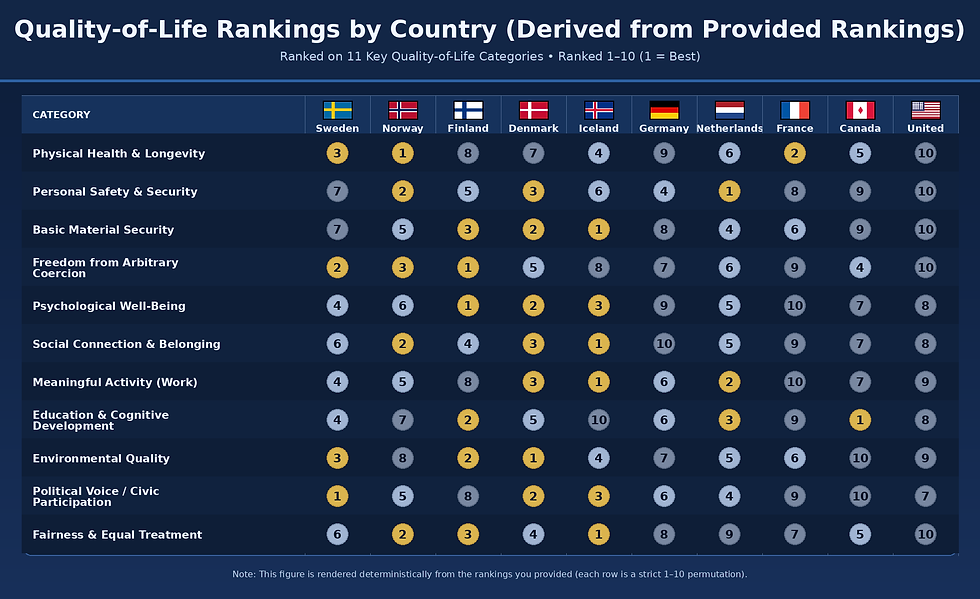
This analysis compares ten advanced social democracies—Sweden, Norway, Finland, Denmark, Iceland, Germany, the Netherlands, France, and Canada to the United States—across twelve widely recognized quality-of-life metrics. Drawing on the most recent international data from institutions such as the United Nations, OECD, World Bank, Freedom House, Yale’s Environmental Performance Index, and the World Happiness Report, the rankings aim to capture how effectively each country converts economic capacity, governance, and social policy into lived human well-being. Rather than focusing narrowly on GDP or income, the framework emphasizes outcomes that are broadly considered universal: health, safety, material security, freedom, psychological well-being, social connection, meaningful work, education, environmental quality, civic participation, and fairness.
Across nearly all metrics, a consistent pattern emerges. The Nordic countries dominate the top ranks, reflecting strong welfare states, high social trust, robust democratic institutions, and a sustained emphasis on equality and preventive investment in human well-being. Continental European countries and Canada tend to occupy a solid middle tier, performing well overall but with more variation across specific dimensions such as employment, civic participation, or environmental outcomes. The United States stands apart as a notable outlier: while it remains a high-income country with strengths in innovation and higher education, it ranks lower on many core quality-of-life indicators, particularly longevity, personal safety, material security, inequality, and psychological well-being. Taken together, these comparisons suggest that policy choices—not national wealth alone—play a decisive role in shaping the everyday quality of life experienced by citizens.

Physical Health & Longevity

This metric can be gauged by life expectancy. Among these countries, the Nordic and Western European nations lead in longevity. Based on latest UN estimates of life expectancy at birth (both sexes), the ranking is:
Norway – 83.6 years. Norway has one of the highest life expectancies in the world.
France – 83.6 years. France’s life expectancy is virtually tied with Norway’s, reflecting strong healthcare and lifestyle factors.
Sweden – 83.6 years. Sweden’s longevity is on par with France (differences only in decimals).
Iceland – 83.2 years. Icelanders enjoy robust health and long lives.
Canada – 82.9 years. Canada’s life expectancy is slightly lower than the top European countries.
Netherlands – 82.5 years. The Dutch benefit from a high standard of healthcare.
Denmark – 82.3 years. Denmark’s longevity is a bit lower than its Nordic neighbors.
Finland – 82.2 years. Finland has improved in recent decades, though still slightly behind other Nordics.
Germany – 81.7 years. Germany’s life expectancy is around the OECD average.
United States – 79.6 years. The U.S. has the lowest longevity here, due in part to higher chronic disease and inequality.
(Higher rank = longer life expectancy. Data are 2025 estimates for life expectancy at birth .)
Personal Safety & Security
A common indicator is the intentional homicide rate (per 100,000 people), where a lower rate means a safer society. By that measure, European countries dominate the top ranks for safety, while the U.S. lags behind. Ranked by lowest homicide rate:
Netherlands – 0.69 per 100k. Extremely low violent crime rate.
Norway – 0.72 per 100k. One of the safest countries globally.
Denmark – 0.84 per 100k. Very low crime and strong social trust.
Germany – 0.91 per 100k. Low homicide rate in Germany.
Finland – 0.98 per 100k. Finland’s rate is under 1, reflecting high safety.
Iceland – 1.07 per 100k. Only a handful of homicides per year (small population) .
Sweden – 1.15 per 100k. Slightly higher than its Nordic peers, but still low.
France – 1.31 per 100k. A relatively low rate, though higher than Northern Europe.
Canada – 2.27 per 100k. Higher than Europe; gun violence contributes to this rate.
United States – 5.76 per 100k. By far the highest homicide rate in this group.
(Higher rank = lower homicide rate, indicating greater personal safety .)
Basic Material Security
This refers to meeting basic needs and avoiding extreme financial hardship. A key indicator is the relative poverty rate (share of people living on less than half the median income, after taxes and transfers – lower is better). By latest data, the ranking is:
Iceland – ≈6% (very low poverty). Iceland consistently has one of the lowest poverty rates.
Denmark – ~6.5%. Denmark’s strong social safety net keeps poverty at a minimum.
Finland – 6.7%. Finland’s relative poverty is also among the lowest.
Netherlands – 7.4%. The Netherlands has low poverty by OECD standards .
Norway – 8.0%. Norway’s oil-funded welfare system results in low poverty .
France – 8.3%. France’s poverty rate is low thanks to extensive social programs .
Sweden – 8.4%. Sweden maintains low poverty through redistribution .
Germany – ~11.6%. Germany’s poverty rate is modest but higher than the Nordic average .
Canada – ~11.9%. Canada’s poverty rate is similar to Germany’s in recent data .
United States – ~18.1%. The U.S. has the highest poverty rate of this group, reflecting greater inequality.
(Higher rank = lower poverty rate among the population .)
Freedom from Arbitrary Coercion
This metric reflects civil liberties, personal freedoms, and rule of law – essentially freedom from oppressive coercion by government or others. All these countries are free democracies, but scores from Freedom House (aggregate 0–100 for political rights/civil liberties) show gradations:
Finland – 100/100. Perfect score for freedom and rights.
Sweden – 99/100. Swedes enjoy full civil liberties and political rights.
Norway – 99/100. Norway is also at the top, with only minor infractions noted.
Canada – 97/100. Canada ranks among the freest, with strong protections for rights.
Denmark – 97/100. Danes have very high freedom, with only minor civil liberty concerns.
Netherlands – 97/100. The Netherlands scores extremely high on personal freedoms as well.
Germany – 95/100. Germany is rated free, though issues like privacy laws and extremism monitoring affect the score.
Iceland – 95/100. Iceland is very free, with minor issues (e.g. small media market concentration) noted.
France – 89/100. France is free but loses points over issues such as restrictions on religious attire and protest policing.
United States – 84/100. The U.S. has a robust democracy but is marked down for problems like gerrymandering and political polarization.
(Higher rank = higher Freedom House score, indicating greater protection from arbitrary coercion .)
Psychological Well-Being
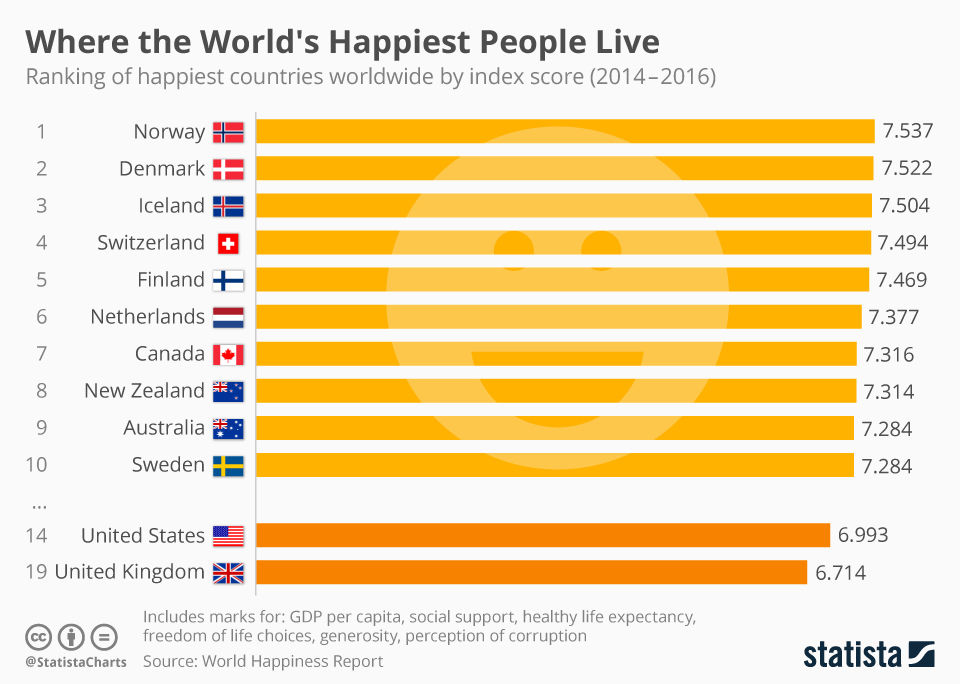
Often measured by subjective life satisfaction or happiness. According to the World Happiness Report 2024 (which averages life evaluations 2021–2023), the happiest countries in this set are the Nordics:
Finland – 7.74 (happiness score, out of 10). Finland is famously the world’s happiest country.
Denmark – 7.58. Denmark ranks second globally in happiness.
Iceland – 7.53. Iceland is close behind in life satisfaction.
Sweden – 7.34. Swedes report very high well-being.
Netherlands – 7.32. The Dutch also score among the top in happiness.
Norway – 7.30. Norwegians are not far behind the other Nordics.
Canada – 6.90. Canadians are happier than many countries, but a notch below the European leaders.
United States – 6.73. The U.S. ranks mid-teens globally; Americans’ happiness is somewhat lower despite high incomes.
Germany – 6.72. Germans report similar life satisfaction to Americans.
France – 6.61. France has the lowest subjective well-being of this group according to surveys .
(Higher rank = higher average life satisfaction score, per World Happiness Report .)
Social Connection & Belonging
This reflects strength of social support networks. One indicator is the share of people who report having relatives or friends they can count on in times of need. In general, the Nordic countries excel in social connectedness . Ranked by support network prevalence (survey data, ≈2019–2020):
Iceland – ~98%. Iceland has the strongest support networks in the world, with virtually all respondents saying they have help if needed.
Norway – ~95–96%. Norwegians report very high social support, in line with the top.
Denmark – ~95%. An extremely high fraction of Danes have a reliable support network.
Finland – ~94%. Finns too have strong family/friend support (Nordic cohesion is high).
Netherlands – ~93–94% (est.). The Dutch community ties are robust, only slightly behind the Nordics (mid-90s).
Sweden – ~93%. A strong majority of Swedes have someone to rely on, though marginally less than in Norway/Denmark.
Canada – ~92% (est.). Canadians report high social support, comparable to European levels (around low-90s).
United States – 90%. About 9 in 10 Americans have support in need – slightly lower than in Western Europe.
France – ~88–89% (est.). France is around the OECD average in social support (roughly 88%).
Germany – ~94% (est.). (Note: Germany was reported at 94.6% in one OECD survey , which would actually place it near the top. However, other aspects of belonging – e.g. loneliness – are mixed. Here we rank primarily by perceived support network.)
(Higher rank = larger share of population with strong social support. Nordic countries dominate this metric .)
Meaningful Activity (Work or Purpose)
Employment is a key source of purpose for most adults. Here we compare employment rates (percentage of working-age population employed). A higher employment rate suggests more people engaged in meaningful work. Ranked by latest employment rate (ages 15–64):
Iceland – 86.5% employed. Iceland has exceptionally high employment participation.
Netherlands – 82.5%. The Dutch labor participation is very high, bolstered by many part-time workers by choice .
Denmark – 77.7%. Denmark’s employment rate is among the top ten globally .
Sweden – 77.5%. Sweden is on par with Denmark in engaging most of its workforce .
Norway – 77.4%. Norway also has a very high employment rate (tied with Germany) .
Germany – 77.4%. Germany’s strong economy yields high employment (tied with Norway) .
Canada – 75.6%. Canada has a solid employment rate, a bit lower than Europe’s leaders .
Finland – 73.8%. Finland’s employment lags the other Nordics, partly due to higher unemployment in recent years .
United States – 71.9% (Q2 2024, 15–64 estimate). U.S. employment is moderate – higher than some EU countries, but lower than Northern Europe.
France – 69.2%. France has the lowest employment rate of this group, reflecting higher unemployment and earlier retirement on average.
(Higher rank = higher percentage of people working, indicating more widespread engagement in work or purposeful activity .)
Education & Cognitive Development
A proxy for education quality is student performance. Using PISA 2018 scores (average of math, reading, science; higher = better academic performance), the ranking is:
Canada – 516.7 (OECD score). Canadian 15-year-olds performed among the top in the world.
Finland – 516.3. Finland is renowned for its education system and was a top performer in PISA.
Netherlands – 502.3. Dutch students score well above OECD average . (Netherlands tied with Sweden).
Sweden – 502.3. Sweden has improved its PISA scores, now roughly equal to the Netherlands.
Denmark – 501.0. Danish students are on par with other high-performing European peers.
Germany – 500.3. Germany is at the OECD benchmark (~500), indicating solid performance.
Norway – 496.7. Norwegian scores are slightly below the OECD average, trailing the above countries.
United States – 495.0. The US improved in reading but remains around average overall .
France – 493.7. France is very close to the US, just a tad below the OECD mean .
Iceland – 481.3. Iceland’s scores are lower than the others’, placing around 30th globally .
(Higher rank = higher student academic performance on PISA tests)
Environmental Quality
Using the 2022 Environmental Performance Index (EPI) – a composite of air quality, climate, and ecosystem metrics – we see a clear lead for the Nordic countries:
Denmark – 77.9 (EPI score). Ranked #1 in the world, excelling in wastewater treatment, air quality, and climate policy.
Finland – 76.5. Finland is a top environmental performer (ranked #3 globally).
Sweden – 72.7. Sweden ranks 5th worldwide, with strong environmental health metrics.
Iceland – 62.8. Iceland has clean energy but a moderate EPI score, partly due to fisheries and land-use factors.
Netherlands – 62.6. The Netherlands scores around the low-60s; strengths in water management offset by intensive agriculture impacts.
France – 62.5. France performs well on environment (e.g. low air pollution) – about on par with the Netherlands and Germany.
Germany – 62.4. Germany’s EPI is similar to France’s; it excels in areas like sanitation, but struggles with rising emissions.
Norway – 59.3. Norway ranks ~20th globally; good on air quality, but its petroleum industry weighs on climate metrics.
United States – 51.1. The U.S. scores relatively low on EPI (due to high greenhouse gas emissions and middling renewable energy uptake).
Canada – 50.0. Canada has the lowest EPI here – it struggles on climate indicators (e.g. rising emissions per capita) despite abundant nature.
(Higher rank = better environmental performance, based on Yale’s EPI scores .)
Political Voice & Civic Participation
A key indicator is voter turnout in free elections – higher turnout suggests a more engaged electorate and stronger civic voice. Recent election turnouts (percentage of registered voters voting) rank as follows:
Sweden – 84.2% (2022 general election) . Swedes have one of the highest voter turnouts among democracies.
Denmark – 84.2% (2022) . Virtually equal to Sweden – Danes are highly civically engaged.
Iceland – 80.2% (2024) . Turnout in Iceland is consistently around 80%, reflecting strong participation.
Netherlands – 77.7% (2023) . Dutch turnout is robust (mid-to-upper 70s).
Norway – 77.2% (2021) . A strong majority of Norwegians vote in national elections.
Germany – 76.6% (2021) . German turnout is similar to Norway’s – roughly three out of four voters.
United States – 70.8% (2020 presidential election) . 2020 saw record-high U.S. turnout (~71% of eligible voters). (Note: US turnout is lower in midterms.)
Finland – 68.5% (2023) . Finnish turnout is slightly below many peers (high-60s).
France – 66.6% (2022/2024) . French turnout has declined in recent elections (about two-thirds of voters) – partly due to voter fatigue in multi-round elections.
Canada – 62.3% (2021) . Canada has the lowest turnout of this group, with roughly 3 in 5 registered voters casting ballots in 2021.
(Higher rank = higher voter turnout, indicating greater political participation .)
Fairness & Equal Treatment
This encompasses equality and social justice. A concrete measure is income inequality (Gini coefficient after taxes/transfers, where 0 = perfect equality). A lower Gini means a more equitable society. By latest OECD data, ranking from most equal to less equal:
Iceland – ≈0.25 Gini (very low inequality). Iceland has one of the world’s most equal income distributions.
Norway – 0.26. Norway’s inequality is extremely low thanks to redistributive policies.
Finland – 0.27. Finland is highly egalitarian as well (Gini ~0.265).
Denmark – 0.27. Denmark’s income equality is similar to Finland’s (Gini in high-0.26 to 0.27 range).
Canada – 0.28. Canada’s post-tax income inequality is surprisingly low, comparable to many European countries.
Sweden – ~0.28. Sweden is very equal, though slightly more unequal than the above (recent Gini ~0.276–0.289).
France – 0.29. France has a low Gini (~0.29), reflecting effective redistribution.
Germany – 0.30. Germany is a bit more unequal than France (Gini ~0.296).
Netherlands – 0.30. The Netherlands is similar to Germany (Gini ~0.30).
United States – 0.38. The U.S. has by far the highest inequality here – its Gini (~0.375) is much higher than the others.
(Higher rank = greater fairness/lower inequality. Nordic countries lead with the most equal incomes .)
Sources:
1. United Nations – World Population Prospectshttps://population.un.org/wpp/
2. World Bank – World Development Indicatorshttps://data.worldbank.org
3. OECD – Better Life Index & Social Indicatorshttps://www.oecdbetterlifeindex.org
4. Freedom House – Freedom in the Worldhttps://freedomhouse.org/report/freedom-world
5. Yale Environmental Performance Index (EPI 2022)https://epi.yale.edu
6. World Happiness Report 2024https://worldhappiness.report
7. United Nations Office on Drugs and Crime (UNODC)https://dataunodc.un.org
8. OECD Income Distribution Databasehttps://www.oecd.org/social/income-distribution-database.htm
9. Gallup World Poll Methodologyhttps://www.gallup.com/analytics/232838/world-poll.aspx
10. OECD Employment Databasehttps://stats.oecd.org
11. OECD PISA Resultshttps://www.oecd.org/pisa/
12. International IDEA – Voter Turnout Databasehttps://www.idea.int/data-tools/data/voter-turnout

Comments